|
Cycling App Professional
V7.4.5
for Garmin ConnectIQ-Compatible Devices
|
|
Cycling App Professional
V7.4.5
for Garmin ConnectIQ-Compatible Devices
|
This section describes the most important features of the Cycling App Professional in more detail. Here a short summary:
This section describes the workout session features which are very similar among all of our Garmin Connect IQ™ applications. The current workout session status is indicated by a specific sign. Following table provides an overview about all possible states of a workout session.
| Session status | Visualization | Description |
|---|---|---|
| NOT STARTED | Blinking red border | Workout session (recording) was not started so far. This is the state after starting the app. Press the "START" button to start workout. |
| RUNNING | Constant grey header/footer | Workout session (recording) is running. This is the case after you manually pressed the "START" button. If the auto-stop feature is enabled, the speed must be above the specified limit, otherwise the app automatically enters AUTO-STOP mode. |
| AUTO-STOP | Blinking yellow pause sign | Workout session is in Auto-Stop mode which means that the speed is below the user-defined auto start/stop limit. Please be aware that no session recording takes place in this state. |
| PAUSED | Blinking red stop sign | Workout session (recording) was manually paused in the menu by selection of "Pause Session". It can be resumed at any point in time by entering the menu again and selecting "Resume Session". Please be aware that no session recording takes place in this state. |
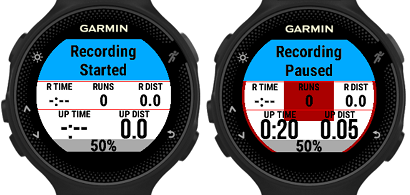
Start a workout session (NOT STARTED)
After starting the app the workout session status is "NOT STARTED" as the session has to be manually started by the user. This can be done by pressing the "START" button. This state is visualized by showing a blinking red boarder every two seconds as illustrates in following picture:
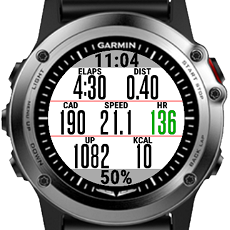
Workout session running (RUNNING)
After pressing the "START" button the first time after app start, the session status changes from "NOT STARTED" to "RUNNING". This is illustrated by a constant grey header/footer as shown in the following picture:
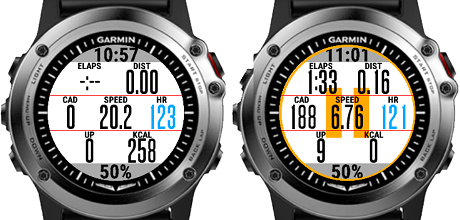
Auto-stop mode (AUTO-STOP)
Whenever the speed goes below the user-specific limit the app automatically enters the "AUTO-STOP" mode. When the speed goes above this limit, the app enters "RUNNING" mode again. This state is visualized by showing a blinking yellow boarder with a pause sign in the middle every two seconds as shown in following picture:
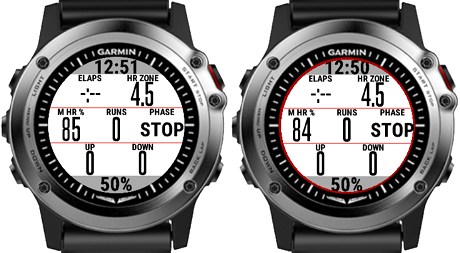
Manually paused session (PAUSED)
The user can manually pause the workout session at any time if the session status is in "RUNNING" or "AUTO-STOP" mode. This can be done by pressing the "START" button. A menu is shown where the user can select among following choices by either pressing the touch screen or by up/down or left/right buttons:
| User selection | Description |
|---|---|
| Resume | Start or resume workout session |
| Pause | Pause workout session. This allows the user to navigate through the data pages. The workout session can be resumed again at any time by pressing "START" button and select "Resume". |
| Save and Exit | Save workout data and close the application. After synchronization with your watch or via Garmin Express Software the workout data will be uploaded to the Garmin cloud and will be visible via Garmin Connect. |
| Discard and Exit | Discard session data and close the application. Please note that all the collected workout data is lost! |
A stopped session is indicated by a blinking red boarder and pause sign in the middle of the screen as shown in following figure:
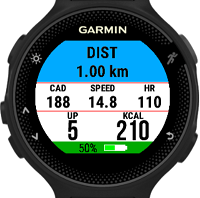
Already the FREE Version of Cycling App Professional provides you basic ALERT features, e.g. to indicate the start and stop of the session recording.
Following figure illustrates how it looks on a Forerunner® 235:
In the PREMIUM Version of the Cycling App Professional following additional ALERT features are provided:
In order to use this feature, please configure the proper "ALERT1 Mode" and "ALERT2 Mode" according to following tables:
| ALERT1 mode | Description |
|---|---|
| Disabled | Feature is disabled. |
| Single distance alert | In this mode a distance ALERT is shown once when the user-defined distance (in km or miles) is reached. |
| Periodic distance alert | In this mode a distance ALERT is shown every time when the user-defined distance (in km or miles) elapsed. |
Following figure illustrates how it looks on a Forerunner® 235:
| ALERT2 mode | Description |
|---|---|
| Disabled | Feature is disabled. |
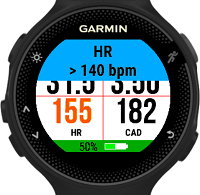
| Heart rate above limit | In this mode a heart rate ALERT is shown when the user-defined limit (in beats per minute) is exceeded. If such an alert is shown then you have ~30 seconds time for reduce the heart rate below the limit, else a new alert is shown again. |
Following figure illustrates how it looks on a Forerunner® 235:
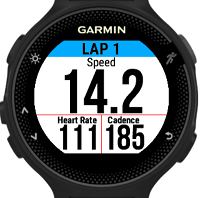
This app offers different LAP features. In order to use them, please configure the proper LAP mode and freely assign the LAP specific data fields in the 2-, 4- or 7-Field data pages according to your personal needs.
| LAP mode | Description |
|---|---|
| Feature disabled | LAP feature is disabled. |
| Manual mode | In this mode the LAP number increases each time when you manually press the "BACK" or "LAP" button on your watch. The feature only works when the workout session is in running or auto-stop mode. |
| Auto mode (distance-based) | In this mode the LAP number increases automatically when the user-configured distance (separate configuration) is reached. The feature only works when the workout session is in running or auto-stop mode. |
| Combined manual/auto mode (distance-based) | In this mode the LAP number increases either manually when pressing the "BACK" or "LAP" button or automatically when the user-configured distance (separate configuration) is reached. The feature only works when the workout session is in running or auto-stop mode. |
Following figure illustrates how it looks on a Forerunner® 235:
LAP-related data fields Following LAP-related data fields are available which can be freely assigned via configuration in the PREMIUM Version to any data field of the 2-, 4- or 7-Field Data Pages:
| Field | Description |
|---|---|
| LAP | Current LAP number |
| CL DIST | Current LAP distance in km or mi |
| CL PACE | Current LAP pace in the format mm:ss |
| CL SPEED | Current LAP speed (average) in km/h or mi/h |
| CL TIME | Current LAP time in the format hh:mm or mm:ss |
| LL DIST | Last LAP distance in km or mi |
| LL PACE | Last LAP pace in the format mm:ss |
| LL SPEED | Last LAP speed (average) in km/h or mi/h |
| LL TIME | Last LAP time in the format hh:mm or mm:ss |
Additional information Following additional LAP-feature related information is provided:
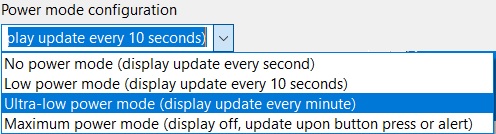
The user can choose one of the following four different power modes in order to reduce battery drain:
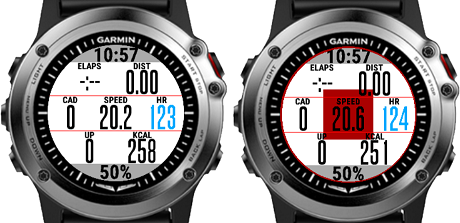
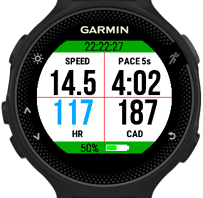
Data field coloring is currently only supported for the heart rate related data fields and has to be enabled via the user settings.
Following table describes the color coding:
| HR zone | Color | Percentage of maximum heart rate |
|---|---|---|
| Zone 0 | BLACK | M HR % < 50 |
| Zone 1 | GREY | 50 <= M HR % < 59 |
| Zone 2 | BLUE | 60 <= M HR % < 69 |
| Zone 3 | GREEN | 70 <= M HR % < 79 |
| Zone 4 | ORANGE | 80 <= M HR % < 89 |
| Zone 5 | RED | 90 <= M HR % < 99 |
| Zone 6 | DARK RED | M HR % >= 100 |
Following figure illustrates how it looks on a Forerunner® 235:
When the session is started, the screen lock feature can be activated by following sequence:
When the screen lock feature is active, only the "START" button will be handled anymore, all other buttons or touch screen inputs are ignored.
To disable the screen lock again, please perform following steps:
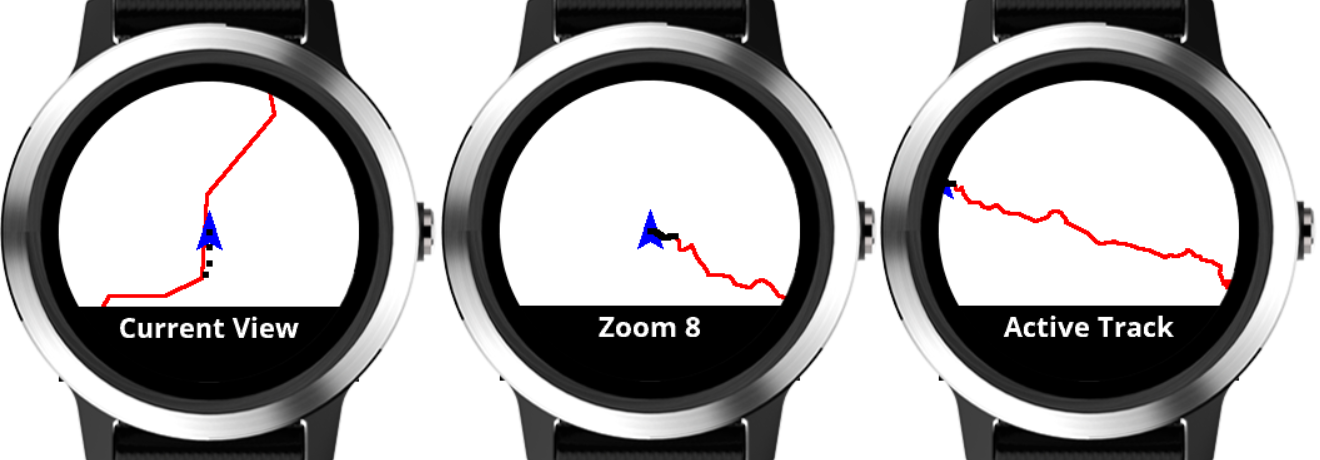
This application shows map information on Garmin devices with integrated map features. On all Garmin devices with CIQ 2 and higher it shows the current track as well as a downloaded track from dynamicWatch.
The current track is shown by enabling the map page in the app settings or by downloading a track from dynamicWatch via the watch menu entry "Navigation/Download Track".
When the map page is active following different modes are available which can be selected by pressing the "START" button:
Following picture shows some of the offered modes:
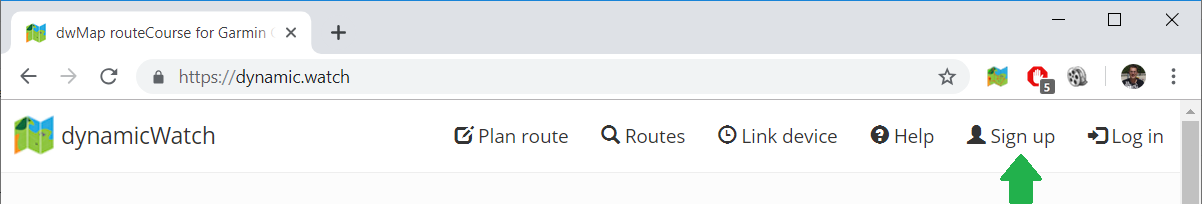
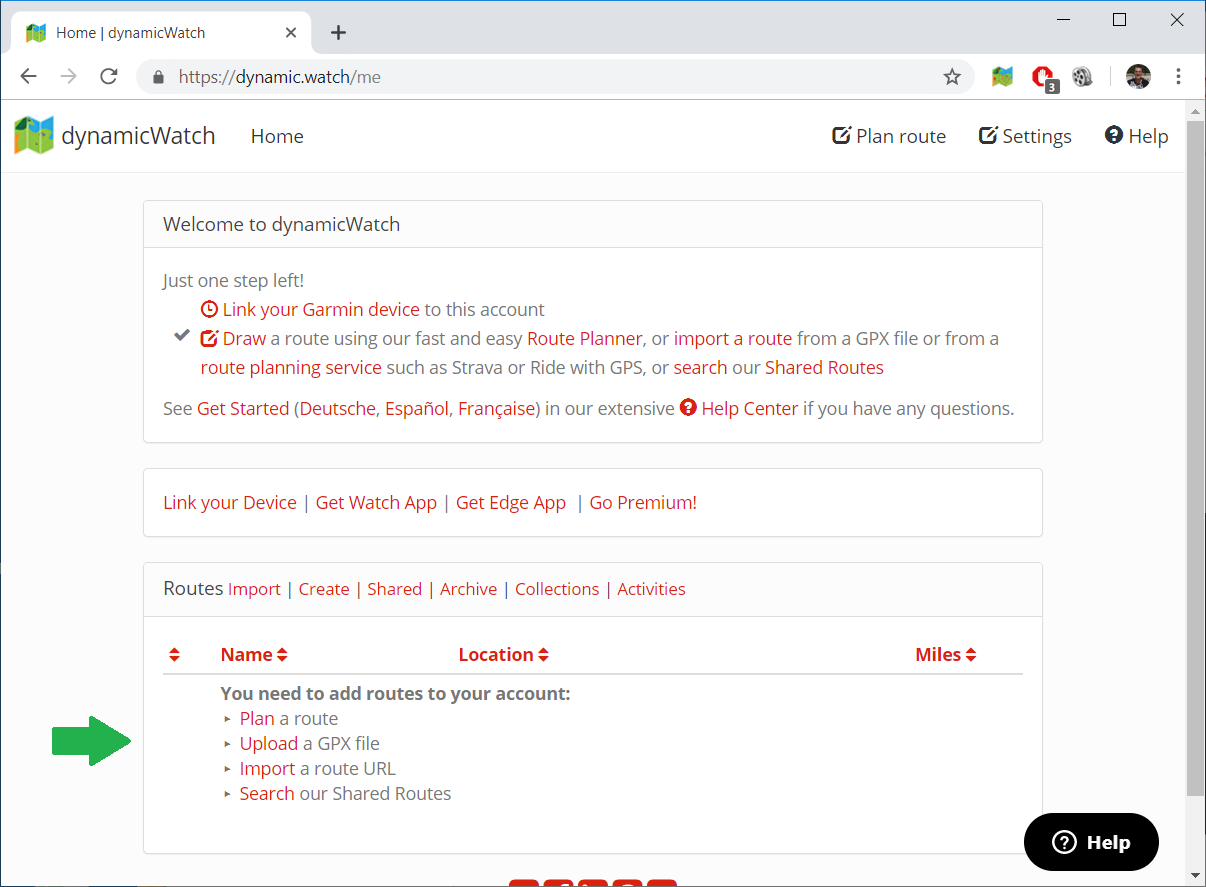
Visit the dynamicWatch web site and sign up for a new account as illustrated in the figure below:
You can now create a new route for example by uploading a GPX file as shown in following figure:
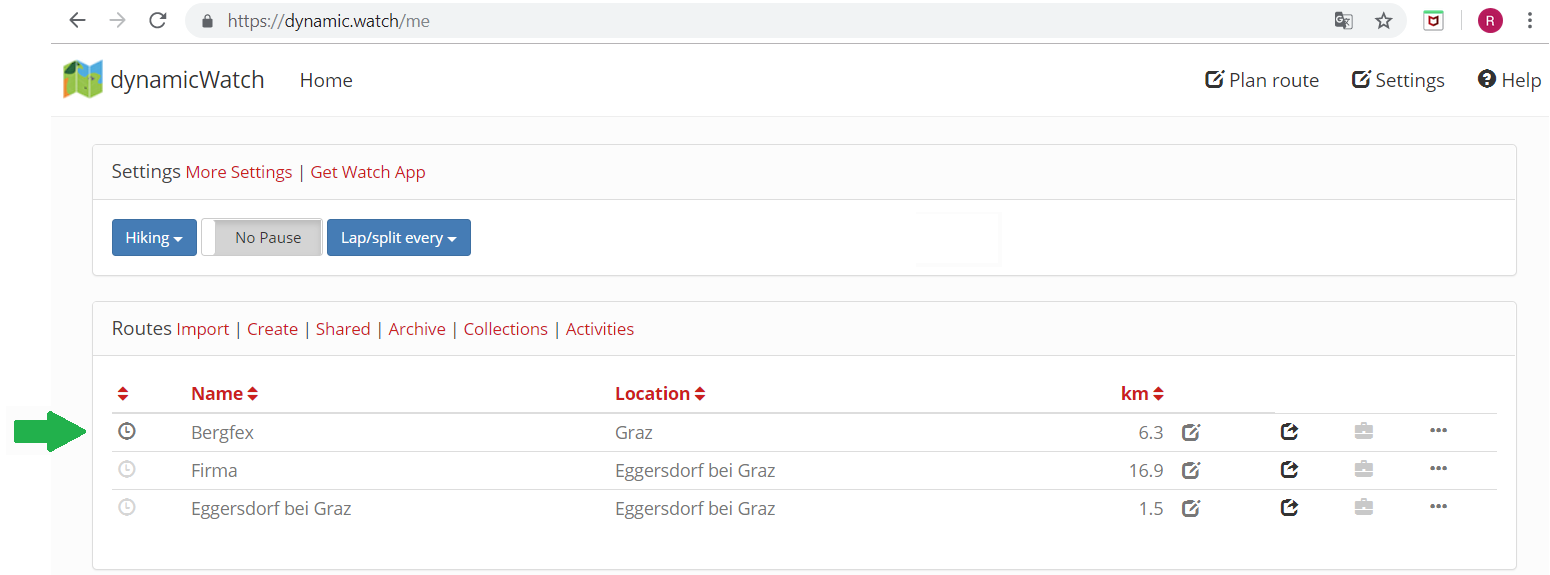
After uploading the route, click on Back or the X icon to close the edit screen and make sure that this route is marked as your active route (the clock icon is black next to your active route) as shown below:
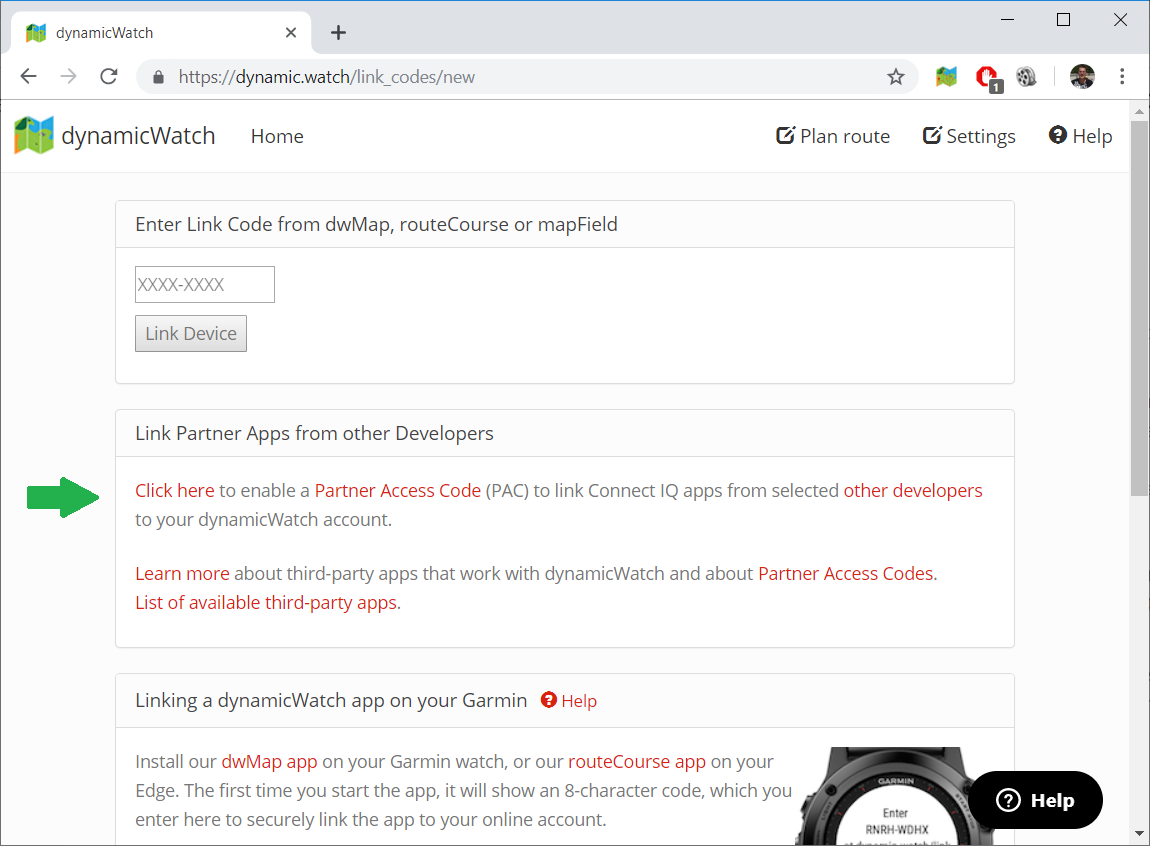
The Cycling App Professional uses the Partner App Code system from dynamicWatch to download the routes. Before you can use this system, you need to enable this Partner App Code system. Click on Link your device and then click on Click to enable.
Copy the Partner Access Code to the clipboard
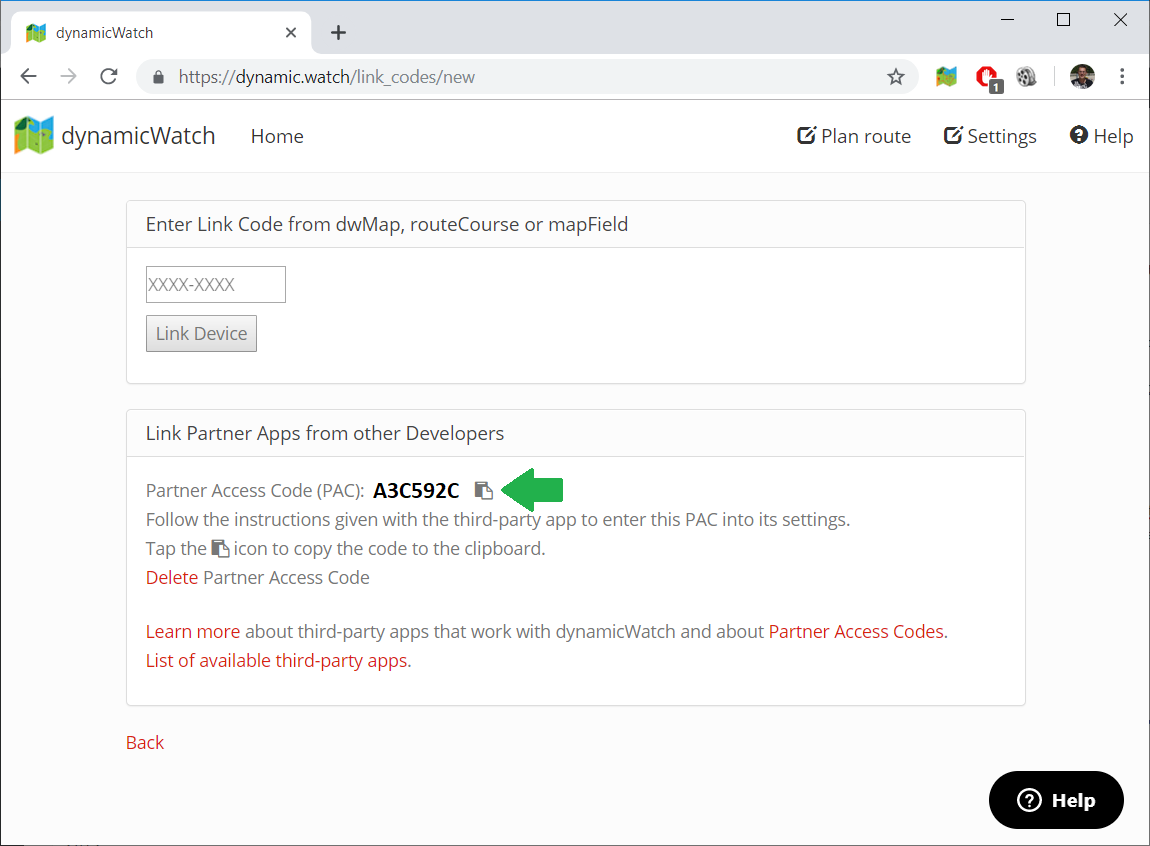
As last step, please add the 7-character partner access code to the app settings of the Cycling App Professional.
If you later want to revoke access to your account from all partner apps, you can delete the PAC in Link Partner App in Settings.
For further details, please refer to the documentation of dynamicWatch
This data field supports the ANT+ power sensor profile even on Garmin devices where this is not offered by Garmin itself. This includes following devices:
The pairing with the ANT+ power sensor is done automatically by the data field, based on the user settings.
During the workout following information can be shown on the data pages:
In case the ANT+ power sensor supports cadence this information is derived from there as well. Following information is available during the workout:
If a workout is executed with a present ANT+ power sensor then following information is captured and later stored on Garmin Connect:
After saving the workout session a workout summary is shown on devices with CIQ2 and later with following information:
 1.8.15